

Predict House Prices with Linear Regression with Python. Data science and data analytics can be used to help real estate professionals gain insights into the real estate market and make more informed decisions. Data science can help identify trends in the market, analyze consumer behaviour, and predict future market movements. Data analytics can be used to gain insights into pricing trends, identify potential investments, and manage risk.
Data science and data analytics can also be used to optimize marketing strategies, improve customer service, and better manage customer relationships. Additionally, data science and data analytics can be used to identify and analyze patterns in the real estate industry, identify new opportunities, and improve operational efficiency.
In this article, we will be working on a dataset consisting of information about the house’s location, price, and other aspects of buying the house. We will learn how to make a model that can give us a good prediction of the price of the house based on different variables. We are going to use Linear Regression for this dataset and see if it gives us good accuracy or not.
Video: – Estimating price of houses (Data Analysis & Statics)
Data Analysis
Guiding Step for House Data Analysis
Step 1. Import dependent functions and libraries.
Step 2. Load Boston data from sklearn datasets and print boston house data keys.
Step 3. Add price column with data set
Now, add the “PRICE” index with our data for analysis of price with a different – 2 Index. also, here we find min, max & median values of the house price
Step 4. To analyse data, we find out basic information like null values and number of columns.
Output:
Note: we do not have any null values in data set.
Step 5. Replace Null Values
If you have null values, replace these null values with the median values of features.
Step 6. Find insight values.
Find out the description of the price column data set to see the most occurrence price & minimum price occurrence values.
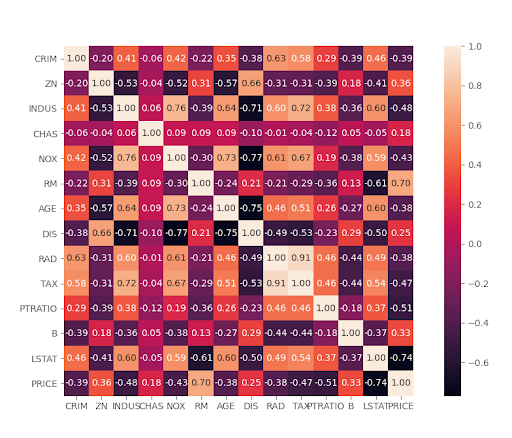
Step 7. Correlation with price.
To use key columns for predicting the price of the house, find out the most co-related key column.
A. Correlation Matrix: It is a table showing correlation coefficients between sets of features. Values close to 1 and -1 indicate strong correlation.
Output:
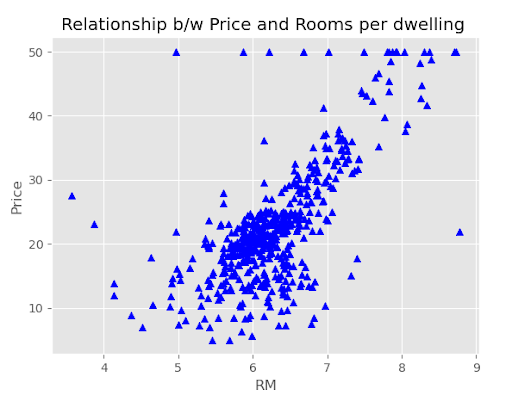
B. Relationship b/w “PRICE” & “RM”(Room per dwelling).
Output:
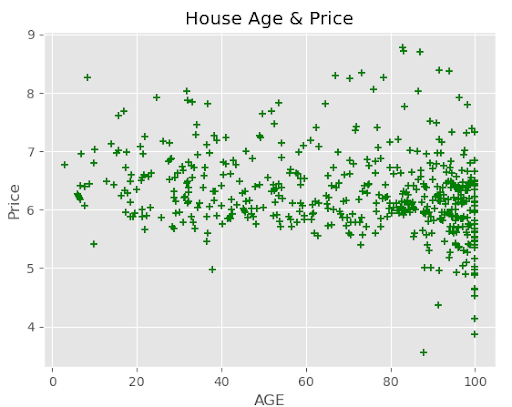
C. Relationship b/w age of house and price.
Output:
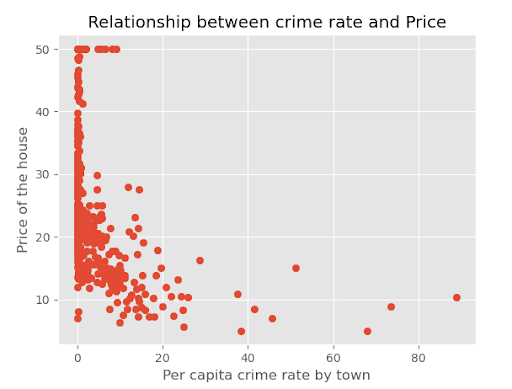
D. Relation b/w price and per capita crime rate by town.
Output:
Note: According to the previous data analysis, find out room per dwelling. It shows the highest correlation with price. Next, to predict the price value of the house, use room per dwelling as a dependent data set for linear regression.
Linear Regression Model
Guiding step for predicting price of the house.
Step 1. Import dependent functions and libraries.
Step 2. Split data set into test and training data set.
According to the previous data visualization, “RM” feature shows a strong correlation with the price. So, we take test and train data sets of RM and Price features.
Note: The whole data set is divided into the training set and test set, in which the train in the sklearn library is used_ test_ Split function, which is used to divide the data set. Set the training data set to 80%.
Output:
![]()
So, here we divide two datasets into training and testing data.
Step 3. Reshape array with numpy array.
Establish a linear regression model and use the training set to train_ Train and Y_ Trains are all one-dimensional arrays, which need to be converted into two-dimensional matrices. Here, we use a reshape function in a numpy library to transform them into two-dimensional matrices.
Step 4. Define linear regression function to train our dataset to find out predicted values.
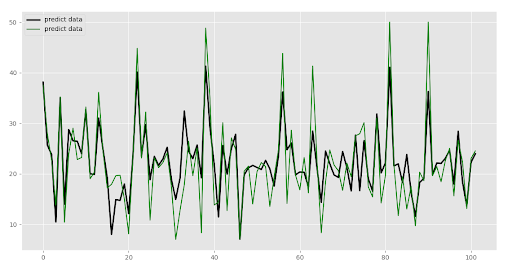
Step 5. Test model with test data set.
Use the test set data to test, get the prediction results, and draw a line chart between the predicted results and the real results, which can directly show the fitting effect.
Note: “pred” is the predicted value of price for “RM” test data sets.
Output:
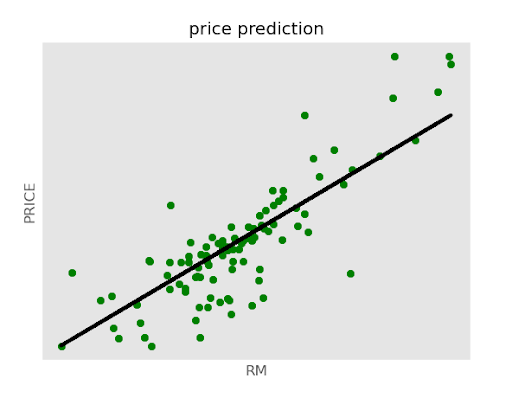
Step 6. Plot regression line.
Also, draw the fitting function and test set data, and you can directly see the fit degree of the regression function and training set. The model uses the function fitted by the training set data to predict, so the fitting function can be obtained by inputting the training set data into the model.
Output:
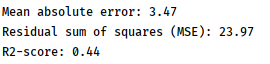
Step 7. Find out the standard deviation of error.
Output:
Conclusion:
This data science and data analytics tutorial in real estate has provided you with an overview of how data science and analytics tools can be used to improve decision-making in the real estate industry. You have seen how data science and analytics can be used to identify trends, optimize marketing campaigns, and analyze customer behaviour. With the help of this tutorial, you now have the necessary knowledge to use data science and analytics to make better decisions in the real estate industry.
Also you may like – A Guide to Face Detection in Python

Leave A Comment
Related Posts
Coding is generally considered a boring activity. After all, who wants to sit in front of a computer all day writing in a language that can’t even be read? But that is not all there is to code. It can be used for some really fun coding facts stuff, and there is so much amazing work that you can do only if you knew how to code.
5 Coding Facts That Blow Your Mind
Let us look at five great fun coding facts you might not know about coding.
You Can Make Games With Code
Coding is an umbrella term for the scores of languages and their versions that programmers use to make their applications. We have all played games, on consoles, our mobile phones, or our desktop computers and laptops, at some point in our life. It might not surprise you to know that these games are also created using code. The complex physics of the characters in these games, the design of the environment of the games, and each minute movement in the games have a piece of code behind them.
Game designers typically write in languages such as C++, C#, and Java. These are also some of the most popular kids coding languages, especially for children who like gaming. Coding courses are available widely in all of these languages and the broad domain of game design.
You Do Better At School If You Code
Making games and indulging in the fun applications of coding is all fine, but coding can have great advantages at school as well. Once you start taking classes that teach coding for kids, you will realize that coding requires a lot of brainpower as well. Coding even for the most fun tasks requires you to think quite a bit, and this sharpens your mind and increases your capability to think logically.
This logical capability can be of a lot of use to you at school. Especially in subjects like mathematics, you might find yourself topping the class simply because of the practice you got during coding! In fact, coding and mathematics have a kind of symbiotic relationship – what you learn in maths comes of use in code and vice versa.
You Can Follow Your Interest Using Coding
Regardless of what your favorite subject is, or what fields you are interested in, you will find a use for code everywhere. Be it through developing software, creating an all-new app, making a game, or building a simple utility, you will find that coding facts can be a way to enable you to follow your interests through a different path.
All subjects from science to social studies and from mathematics to philosophy use coding in some way for research or education. Be it sports or music, art or architecture, utilities that are made using code are prevalent in every field that you can think of. Taking simple online coding courses can qualify you and build your interest in creating such utilities.
You Can Predict Future Events Through Code
Did you know that predicting the future is an application of coding! Predictive modeling is a field of programming in which code is used to try and predict what will happen in the future on the basis of events that took place in the past. It uses concepts of artificial intelligence and machine learning to create algorithms that learn the behavior of past data and determine the course of future data.
Predictive modeling is one of the most futuristic applications of code and is used to determine everything from the next movie you will like on Netflix to whether it will rain tomorrow. You can opt for closing classes in machine learning to know more about the field, and create your own utilities to predict the future!
Coding Is Free!
You don’t need any sophisticated apparatus except your laptop for coding. All you need is the will to learn more and follow your interests through code. To learn to code you do not need to go to a special school or have any special capabilities. You can opt for free coding classes for kids which are held completely online and follow a completely hands-off approach in helping kids learn to code. There are also a vast number of coding sites for kids on which they can log in to learn basic coding facts for kids without even having to enroll in a class.
Conclusion
The future is already being written, and it is being written in code. Coding for kids classes can help kids of all ages currently going to school not just learn to code but also to have fun in the process. The above applications of code can be a major stepping stone to build the interest of kids in coding, after which they can hone their interests and new skills on even more advanced applications. A platform such as Learningbix can be an excellent way for you to get started.