

Description:
Multiple linear regression is a statistical method used to analyze the linear relationship between two or more independent variables (predictors) and one dependent variable (outcome). It is used to predict the value of the dependent variable (outcome) based on the values of the independent variables (predictors). This type of regression is sometimes referred to as multivariate linear regression.
Multiple linear regression is used to predict the outcome of a dependent variable, given multiple independent variables. It is used to understand the relationship between several independent variables and one dependent variable. It can help to determine the effect of one independent variable on the dependent variable, while controlling for the effect of other independent variables.
Multiple linear regression lets you know:
How strong is the relationship between two or more independent variables and one dependent variable.
The value of the dependent variable at a certain value of the independent variables.
Multiple Linear Regression Formula
![]()
Here:
- yi is dependent or predicted variable
- β0 is the y-intercept, i.e., the value of y when both xi and x2 are 0.
- β1 and β2 are the regression coefficients that represent the change in y relative to a one-unit change in xi1 and xi2, respectively.
- βp is the slope coefficient for each independent variable
- ϵ is the model’s random error (residual) term.
Multiple linear regression is based on the following assumptions:
- A linear relationship between the dependent and independent variables
- The independent variables are not highly correlated with each other
- The variance of the residuals is constant
- Independence of observation
Steps to Implement the House Price Prediction using a Multiple Linear Regression Algorithm
Step 1. Import dependent libraries and its function for this project.
Step 2. Read Bengaluru house data CSV file in panda framework.
Output: Data load into the panda’s data framework
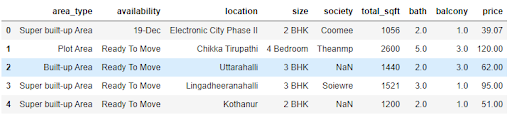
Step 3. Read Bengaluru house data CSV file in panda framework.
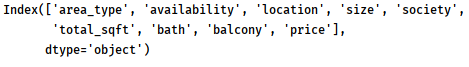
There are 9 feature columns but in these columns, many columns are not required. So, these columns can be dropped.
Step 4. Check “area type” features.
Output:
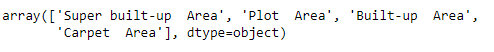
Note: “area_type”, “society”, “balcony”, and “availability” columns have string values that are not used to predict the price of a house so we drop these columns. So, we use only two key columns built-up area and size.
Step 5. Now, handle null values of the index.
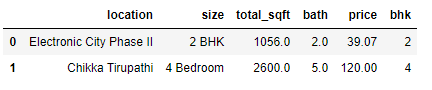
Step 6. In the “size” column, you have a string data type. You need to refract numbers from string to simplify this data set.
Step 7. Now, explore the total square fit value because square fit has range values within the dataset so, handle these types of data sets.
Note: You can see the values of total _sqft in the range form. Split this data and find the mean of this range by adding and dividing by 2.
Output 1:
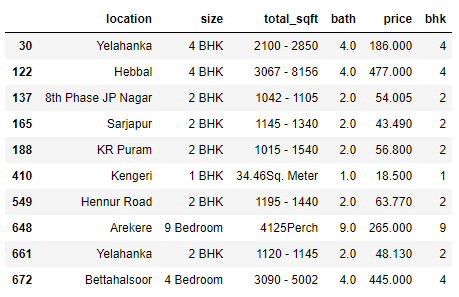
Output 2:
Note: For the row below, it shows total_sqft as 2475 which is an average of the range 2100-2850
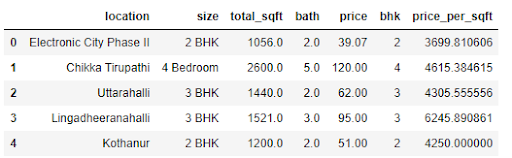
Step 8. Now, add a new feature in this data frame called price per square feet.
Output:
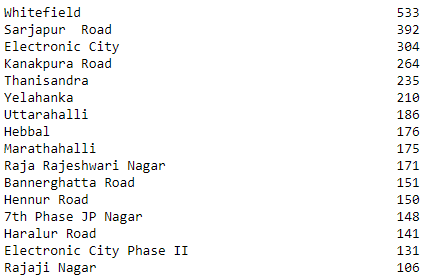
Step 9. Examine locations which is a categorical variable. Apply dimensionality reduction techniques here to reduce the number of locations.
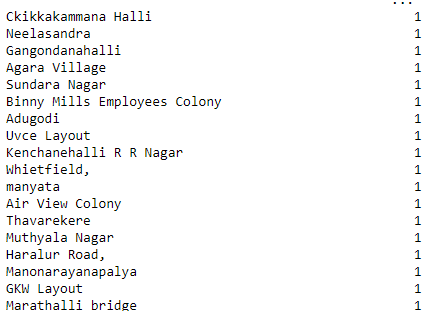 Output:
Step 10. Any location that has less than 10 data points should be tagged as “other” location. This way the number of categories can be reduced by a huge amount. Later on, when one hot encoding is done, it will help us with having fewer dummy columns.
Output:
Step 11. As a data scientist when you have a conversation with your business manager (who has expertise in real estate), he/she will tell you that normally square ft per bedroom is 300 (i.e. 2 bhk apartment is minimum 600 sqft. If you have for example a 400 sq ft apartment with 2 bhk then that seems suspicious and can be removed as an outlier. We will remove such outliers by keeping our minimum threshold per bhk to be 300 sq ft.
Step 12. Check static values price outliers for max & minimum values.
Note: Find that min price per sqft is 267 rs/sqft where the max is 12000000. This shows a wide variation in property prices. Remove outliers per location using mean and one standard deviation.
Step 13. Check static values price outliers for max & minimum values.
Output:
Note: Find that min price per sqft is 267 rs/sqft where max is 12000000. This shows a wide variation in property prices. Remove outliers per location using mean and one standard deviation.
Step 14. Define remove_pps_outliers function to remove outliers of the location data set.
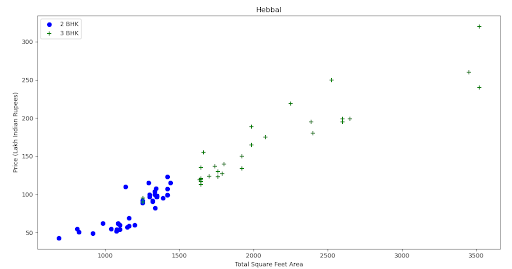
Step 15. Check if for a given location, how does the 2 BHK and 3 BHK property prices look like.
Output:
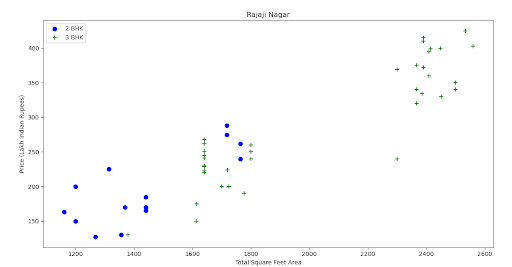
Step 16. Remove those 2 BHK apartments whose price_per_sqft is less than mean price_per_sqft of 1 BHK apartment.
Step 17. Plot the graph.
Output:

Step 18. Plot bar graph for per square feet values to understand maximum and minimum count.
Note: You can see that values from maximum values fall b/w 1000 to 10000 rupees per square foot.
Step 19. Now, plot the bar graph for bath count in houses.
Note: So, you can see that Number of bathrooms range from 2 to 6.
Step 20. It is unusual to have 2 more bathrooms than the number of bedrooms in a home.
Step 21. Again, the business manager has a conversation with you (i.e. a data scientist) that if you have a 4 bedroom home and even if you have a bathroom in all 4 rooms plus one guest bathroom, you will have a total bath = total bed + 1 max. Anything above that is an outlier or a data error and can be removed.
Step 22. Drop the size and price per sqft values from our data frame.
Step 23. Now, make a model to predict the price.
Step 24. For implementing this model, use the sklearn library and its function like linear regression. Split out the data frame into training and test data frame.
Step 25. Now, import linear regression functions from sklearn.linear_model. Also, fit our test and train data for linear regression.
Step 26. Now, check the accuracy of linear regression by k-fold cross-validation.
Note: Our Machine Learning model learns one by one cross-validation.
Step 27. Now, make the function for the prediction of price in lacs.
Output:
0.869132245229449 (In Crore)
Conclusion:
In summary, this tutorial demonstrated how to use a Multiple Linear Regression algorithm to predict house prices. We discussed important topics such as data preprocessing, feature selection, model construction, training and evaluation. Finally, we demonstrated how to interpret our model’s results and how to improve its accuracy. We hope that this tutorial has been useful in helping you understand the basics of Multiple Linear Regression and how to implement it for house price prediction.

Leave A Comment
Related Posts
Coding is generally considered a boring activity. After all, who wants to sit in front of a computer all day writing in a language that can’t even be read? But that is not all there is to code. It can be used for some really fun coding facts stuff, and there is so much amazing work that you can do only if you knew how to code.
5 Coding Facts That Blow Your Mind
Let us look at five great fun coding facts you might not know about coding.
You Can Make Games With Code
Coding is an umbrella term for the scores of languages and their versions that programmers use to make their applications. We have all played games, on consoles, our mobile phones, or our desktop computers and laptops, at some point in our life. It might not surprise you to know that these games are also created using code. The complex physics of the characters in these games, the design of the environment of the games, and each minute movement in the games have a piece of code behind them.
Game designers typically write in languages such as C++, C#, and Java. These are also some of the most popular kids coding languages, especially for children who like gaming. Coding courses are available widely in all of these languages and the broad domain of game design.
You Do Better At School If You Code
Making games and indulging in the fun applications of coding is all fine, but coding can have great advantages at school as well. Once you start taking classes that teach coding for kids, you will realize that coding requires a lot of brainpower as well. Coding even for the most fun tasks requires you to think quite a bit, and this sharpens your mind and increases your capability to think logically.
This logical capability can be of a lot of use to you at school. Especially in subjects like mathematics, you might find yourself topping the class simply because of the practice you got during coding! In fact, coding and mathematics have a kind of symbiotic relationship – what you learn in maths comes of use in code and vice versa.
You Can Follow Your Interest Using Coding
Regardless of what your favorite subject is, or what fields you are interested in, you will find a use for code everywhere. Be it through developing software, creating an all-new app, making a game, or building a simple utility, you will find that coding facts can be a way to enable you to follow your interests through a different path.
All subjects from science to social studies and from mathematics to philosophy use coding in some way for research or education. Be it sports or music, art or architecture, utilities that are made using code are prevalent in every field that you can think of. Taking simple online coding courses can qualify you and build your interest in creating such utilities.
You Can Predict Future Events Through Code
Did you know that predicting the future is an application of coding! Predictive modeling is a field of programming in which code is used to try and predict what will happen in the future on the basis of events that took place in the past. It uses concepts of artificial intelligence and machine learning to create algorithms that learn the behavior of past data and determine the course of future data.
Predictive modeling is one of the most futuristic applications of code and is used to determine everything from the next movie you will like on Netflix to whether it will rain tomorrow. You can opt for closing classes in machine learning to know more about the field, and create your own utilities to predict the future!
Coding Is Free!
You don’t need any sophisticated apparatus except your laptop for coding. All you need is the will to learn more and follow your interests through code. To learn to code you do not need to go to a special school or have any special capabilities. You can opt for free coding classes for kids which are held completely online and follow a completely hands-off approach in helping kids learn to code. There are also a vast number of coding sites for kids on which they can log in to learn basic coding facts for kids without even having to enroll in a class.
Conclusion
The future is already being written, and it is being written in code. Coding for kids classes can help kids of all ages currently going to school not just learn to code but also to have fun in the process. The above applications of code can be a major stepping stone to build the interest of kids in coding, after which they can hone their interests and new skills on even more advanced applications. A platform such as Learningbix can be an excellent way for you to get started.