

Description:
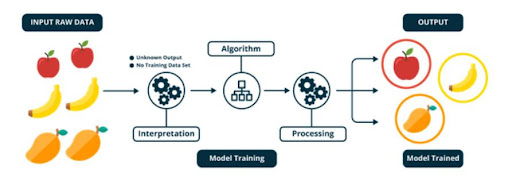
The term ‘Unsupervised’ refers to the fact that the algorithm is not guided like a supervised learning algorithm. Unsupervised learning is a type of machine learning algorithm used to draw inferences from datasets consisting of input data without labeled responses. It is used in many applications, such as clustering, anomaly detection, and recommender systems.
Unsupervised learning can discover hidden patterns and features in data that are not immediately apparent. It can also help with exploratory data analysis and feature selection. It is particularly useful for tasks that do not have a clearly defined output.
Unsupervised algorithms are used to analyze data and identify patterns or trends in the data that would otherwise be difficult to uncover. They are used in a wide range of applications, including customer segmentation, fraud detection, financial forecasting, medical diagnosis, and more.
The unsupervised algorithm works with unlabeled data. It relies on algorithms and techniques like clustering, association rule mining, anomaly detection and neural network models.
An Unsupervised Machine Learning Algorithm is used to:
- Explore the structure of the information.
- Extract valuable insights.
- Detect patterns.
- Implement this into its operation in order to increase efficiency.
Unsupervised learning applies two major techniques viz. clustering and dimensionality reduction.
Clustering:
Clustering is the process of grouping similar data points together and is used for segmentation, recommendation systems, market analysis, and image segmentation. Dimensionality reduction is the process of reducing the number of random variables under consideration and is used for feature extraction, data compression, and visualization.
K-means clustering:
K-means clustering is an unsupervised machine learning algorithm used to create clusters of similar data points. It works by minimizing the sum of squared distances between each data point and its assigned cluster center. The algorithm begins by randomly assigning each data point to a cluster, then iteratively adjusts the cluster centers by computing the mean of all of the points in that cluster. The process is repeated until the clusters are stable and can no longer be further optimized.
K-means clustering is also used in the following operations:
- Audience segmentation
- Customer persona investigation
- Anomaly detection
- Pattern recognition
- Inventory management

K-Means clustering data algorithm:
Step 1. Import dependent libraries.
Step 2. Import data set of people’s income in panda dataframe.
Output:
Step 3. Read Bengaluru house data CSV file in panda framework.
Step 4. According to the scatter plot b/w age and income we analyze in this data have three clusters. Fit the data in 3 kmean clusters.
Output:
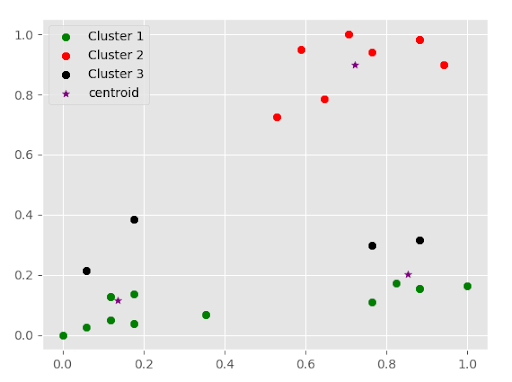
Step 5. Make three different data sets according to the cluster. Plot these data in scatter form.
Note: In this plot, you can see that cluster 2 points are scattered with centroid but cluster 1 and cluster 3 are not scattered with centroid because x and y scale is not proper.
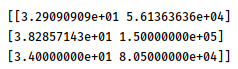
Step 6. Now, scale age and income data sets write ith MinMaxScaler() function for scale each value of the dataset.
Step 7. Again predict clusters.
Step 8. The scale is set so we plot the data b/w age and income data.
Output:
Conclusion:
K-Means clustering is a powerful and simple data clustering algorithm that can quickly discover meaningful structures in large amounts of data. This tutorial has provided an overview of the K-Means algorithm and how to implement it using Python. We discussed the concept of clustering, and the K-Means algorithm and used the K-Means algorithm to cluster a dataset of points into two clusters. Finally, we discussed how to evaluate the performance of the K-Means algorithm. With this knowledge, you are now ready to use the K-Means algorithm to uncover meaningful insights from your own data.

Leave A Comment
Related Posts
Coding is generally considered a boring activity. After all, who wants to sit in front of a computer all day writing in a language that can’t even be read? But that is not all there is to code. It can be used for some really fun coding facts stuff, and there is so much amazing work that you can do only if you knew how to code.
5 Coding Facts That Blow Your Mind
Let us look at five great fun coding facts you might not know about coding.
You Can Make Games With Code
Coding is an umbrella term for the scores of languages and their versions that programmers use to make their applications. We have all played games, on consoles, our mobile phones, or our desktop computers and laptops, at some point in our life. It might not surprise you to know that these games are also created using code. The complex physics of the characters in these games, the design of the environment of the games, and each minute movement in the games have a piece of code behind them.
Game designers typically write in languages such as C++, C#, and Java. These are also some of the most popular kids coding languages, especially for children who like gaming. Coding courses are available widely in all of these languages and the broad domain of game design.
You Do Better At School If You Code
Making games and indulging in the fun applications of coding is all fine, but coding can have great advantages at school as well. Once you start taking classes that teach coding for kids, you will realize that coding requires a lot of brainpower as well. Coding even for the most fun tasks requires you to think quite a bit, and this sharpens your mind and increases your capability to think logically.
This logical capability can be of a lot of use to you at school. Especially in subjects like mathematics, you might find yourself topping the class simply because of the practice you got during coding! In fact, coding and mathematics have a kind of symbiotic relationship – what you learn in maths comes of use in code and vice versa.
You Can Follow Your Interest Using Coding
Regardless of what your favorite subject is, or what fields you are interested in, you will find a use for code everywhere. Be it through developing software, creating an all-new app, making a game, or building a simple utility, you will find that coding facts can be a way to enable you to follow your interests through a different path.
All subjects from science to social studies and from mathematics to philosophy use coding in some way for research or education. Be it sports or music, art or architecture, utilities that are made using code are prevalent in every field that you can think of. Taking simple online coding courses can qualify you and build your interest in creating such utilities.
You Can Predict Future Events Through Code
Did you know that predicting the future is an application of coding! Predictive modeling is a field of programming in which code is used to try and predict what will happen in the future on the basis of events that took place in the past. It uses concepts of artificial intelligence and machine learning to create algorithms that learn the behavior of past data and determine the course of future data.
Predictive modeling is one of the most futuristic applications of code and is used to determine everything from the next movie you will like on Netflix to whether it will rain tomorrow. You can opt for closing classes in machine learning to know more about the field, and create your own utilities to predict the future!
Coding Is Free!
You don’t need any sophisticated apparatus except your laptop for coding. All you need is the will to learn more and follow your interests through code. To learn to code you do not need to go to a special school or have any special capabilities. You can opt for free coding classes for kids which are held completely online and follow a completely hands-off approach in helping kids learn to code. There are also a vast number of coding sites for kids on which they can log in to learn basic coding facts for kids without even having to enroll in a class.
Conclusion
The future is already being written, and it is being written in code. Coding for kids classes can help kids of all ages currently going to school not just learn to code but also to have fun in the process. The above applications of code can be a major stepping stone to build the interest of kids in coding, after which they can hone their interests and new skills on even more advanced applications. A platform such as Learningbix can be an excellent way for you to get started.